I. Toward a Folk Librarianship?
In her talk Humanities Data: A Necessary Contradiction, Miriam Posner suggests that “traditional humanists do have pretty pressing data-management needs. But the need becomes even greater when you’re talking about people who consider themselves digital humanists — that is, people who use digital tools to explore humanities questions.” She focuses on the ways that scholars “are really struggling to organize [their collections] so that they can produce scholarship,” which has “created … real opportunities for libraries.”
Inasmuch as scholars who are not also data curation experts may struggle to organize the collections of data they’re using for their scholarship, such struggles largely overlap with those of just about anyone who generates and collects digital artifacts for any non-ephemeral reason, which is to say, all of us. It is true that traditional and digital humanists often are working with more than just the artifacts themselves, at least some of which are explicitly the domain of libraries and archives and museums and such (broadly, the GLAM institutions). The data needs of humanists extend beyond the normal cataloging and organization schemes of such institutions and reach into the artifacts themselves in search of data that doesn’t fit neatly into a particular metadata schema. That’s more a matter of the particular use, which is an important consideration, but the fundamental problem of initial collection organization remains.
Certainly we can learn from libraries about how to organize and curate our collections for different uses, but often even the most basic library tools are more than most people need. Libraries, after all, are institutions and as such are driven by institutional concerns. Most libraries, for instance, have some sort of collection development policy that informs what goes in and what doesn’t. Where libraries are embedded in other institutions, those policies can be enacted upon anyone producing collectible output, but also could extend to the source datasets. It would then be the library’s job to provide crucial tools for collection and deposit, permission and licensing, description and discovery, access, and preservation.
There must be room here for lay or folk tools to take root, however, because while the space for institutional models of digital artifact deposit, description, access, etc., are quite mature at this point, and institutions have several digital repository models to choose from. Those take care of the final outputs, but not the interstitial concerns, the time between the scholar’s initial data and artifact collection and the point of publication, during which scholars must be able to organize and maintain the materials themselves so they remain accessible for the duration of their research. That places them squarely within the same realm as everyone else, managing as we go. And while library work can be instructive, I think it can also teach the wrong lessons.
I see major points of overlap here with the digital outputs of numerous hobby spaces. My interest in hobby spaces specifically is a form of self-interest since I participate in several. Organizing and describing digital artifacts in general is an easily neglected set of chores made more difficult by both the lack of tools and the ease with which many digital objects proliferate, especially if we are buying or otherwise downloading copies for ourselves. Imagine for a moment collecting a few kinds of electronic documents: 1) fiber art patterns, which are combinations of instructions and images, akin to individual recipes; 2) tabletop roleplaying game materials, which contain at least words and images, but also may include assets for use in virtual tabletops; and 3) purchased ebooks. Only one of these cases, ebooks, might possibly be amenable to forms of automated librarianship such as metadata lookup and assignment (though precisely where one puts that metadata is a major question). In the case of TTRPG materials, many are in fact published through more or less traditional means, with ISBNs and such, but many are not. Nor are all of the potential auxiliary materials that might accompany them, especially if perchance they’re decontextualized and find their way into folders without other identifying metadata. And in the case of the fiber arts patterns, so many of these are available as either single purchases online, or for free, from websites and on Ravelry, that if one happens to keep offline copies of them, organizing them to find later can be a challenge.
I use tools like Calibre for some of this, but it is clearly optimized for ebooks, not the other kinds of materials I put into it, even though PDFs are one of the formats it handles. Forget images, zip files, executables, spreadsheets, and proprietary file formats, except just as a place to store them. Managing libraries of these other kinds of materials, including datasets, will often require more specialized tools, which is why so much of this requires or defaults to institutional support. I am always interested in what exists between the institution and the individual that can foster personal or folk archiving and librarianship.
II. Visualization Praxis
My experience with visualizing data this week really hammered home D’Ignazio and Klein’s assertion that data nor visualizations offer objective truth, echoing Monmonier’s observations in How to Lie with Maps, which we discussed last week. Once again, I was working with data I have been collecting myself, this time something more recent. About this time last year, I purchased solar panels for my house. The management interface produces nice visualizations (Fig. 1) and gives what on the surface sounds like it should be objective data: how much electricity I produced, how much I consumed, how much I imported from the grid, and how much I exported to the grid. This important because I hold as a goal the ability to produce more than I consume, which is good for my electric bill but also good for the grid as a whole.
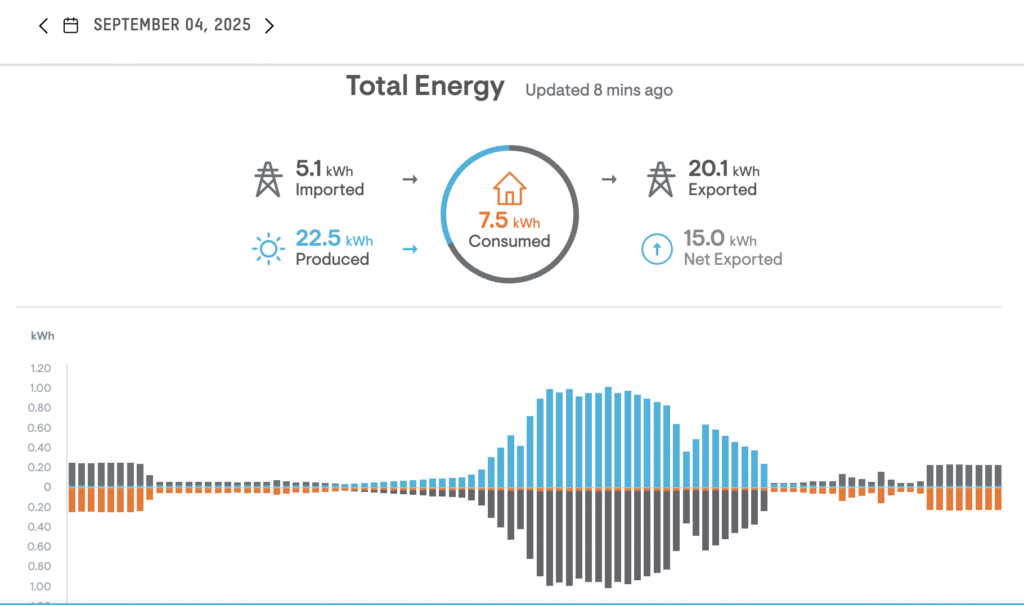
Now, neither these data points nor the resulting visualizations are created by anyone in particular. Aside from the programming that went into them, they are collected and displayed by software automatically. They are a “god trick” in perhaps the purest sense: there is no subjective source for the data, and the assumption is that the software is a neutral arbiter of truth. And it is true that the software for visualizing electricity production and consumption appears to be doing so with a high degree of fidelity to the underlying numbers. But what if those numbers are wrong? Here’s where the “view from nowhere” results in lack of accountability. If the numbers are wrong, who can say? That’s what I’ve been aiming to find out.
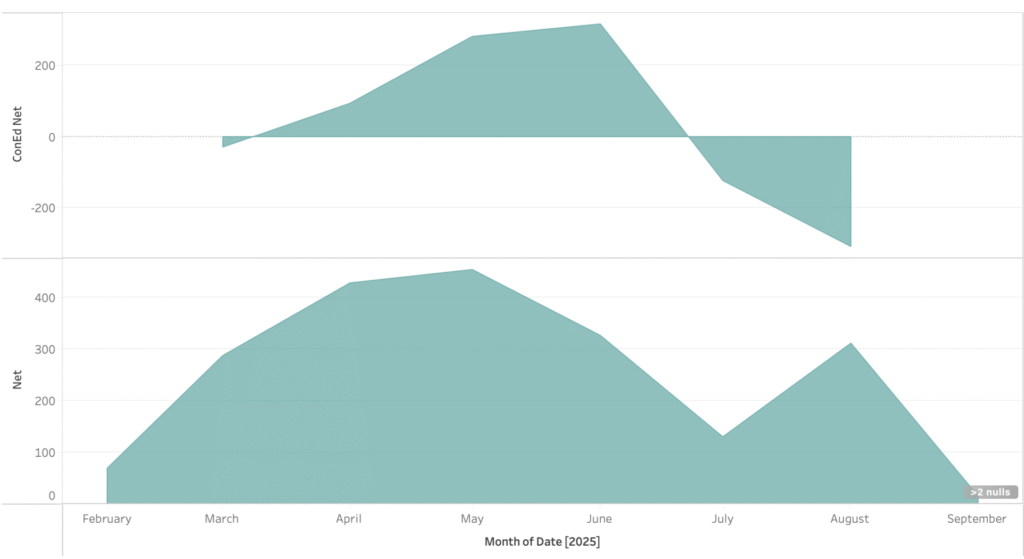
For this exercise, I am using data I have meticulously hand-collected since late February/early March, from a website that produces the data but only displays the details on a daily basis, though I can look at any point in the history of the system. An API would be welcome, but so far I can’t find one. I’m collecting this data so I can align it with my Con Edison billing cycles, which do not align with the beginning or end of the month. Visualizing it wasn’t my original goal, but it can help reinforce the problem I suspected was occurring, which is that the numbers I am getting are not the same as what ConEd sees. In the contest between my numbers and ConEd’s numbers, I think it goes without saying that ConEd wins. That means I have to convince the company that maintains the monitoring tools that something, somewhere, is misconfigured.
In the meantime, enjoy these visualizations (Fig. 2) of my energy production and consumption over the past 7 months. The bottom graph shows what you might expect, that my net production each month increased initially as a function of lengthening days but decreased as a function of increasing heat. The top graph shows what ConEd thinks my net for the month is. At no point do the monthly net production numbers reported by my system fall below zero. Such a rosy picture is quite persuasive: I want to believe, and the companies involved in providing solar energy also want to believe that these numbers are correct. For solar installers, this sort of picture helps them sell more solar installs. For me, it offers a sense of what could be. It’s just not what is. The trick has been gathering the evidence to present so that the company supporting me could no longer deny what I had suspected from early on. It is where one “view from nowhere” collides with another, that of Con Edison.
III. Coda
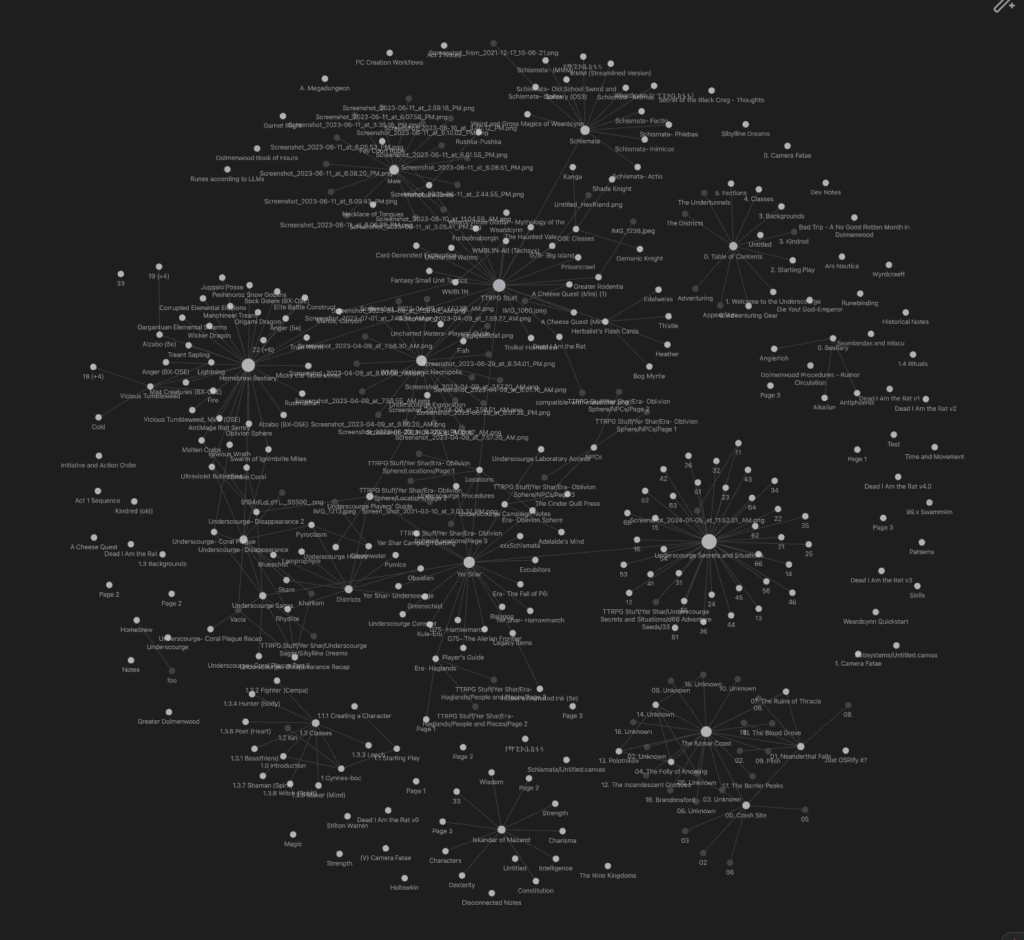
I’m going to end this with a couple more visualizations. The first (Fig. 3) is an ambient artifact of my main note-taking and writing tool, Obisdian, which produces lovely little interactive graphs of connections between notes. This shows one of my Obsidian vaults, which is not nearly as dramatic as some others I’ve seen.
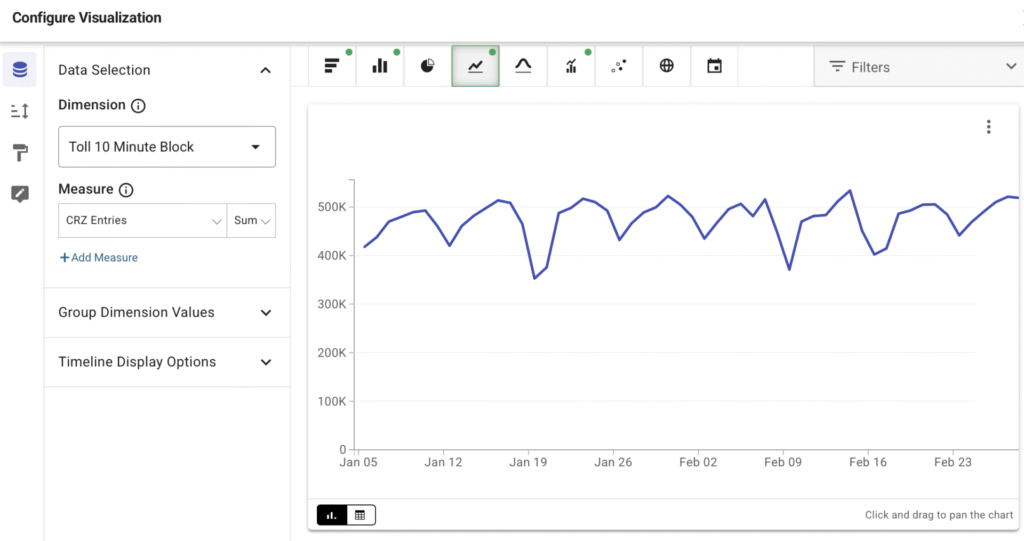
The second (Fig. 4) showcases a tool provided by the State of New York on https://data.ny.gov, which contains numerous state data sets you can explore. On the site, you can generate your own visualizations of various data, like this one primed with 2025 year to date MTA Congestion Relief Zone Vehicle Entries. It’s great to see entities like NY State providing not just the data, but also the means to interact with it visually.